Data Canvas
What is a data canvas and what can you do with it? Check out the video below. It shows a 3D animated data canvas with OOCSI clients (devices) sunk into the floorplan as pink spheres, and OOCSI channels floating on top of the floor plan in blue. The smaller spheres moving between clients and channels are individual events in the OOCSI system with their trajectories.
On this page, we first explain a bit about the general concept of a data canvas, then go into three different forms: the conceptual, formalized and prototype stages. Finally, we explain how you can get started with the first stage. After that you might be interested in the Data Canvas tool on OOCSI, check it out below.
Data Canvas 1
After a short motivation why data is so important in design today, we dive into what a data canvas is. We go through the different types of data canvases, conceptual, planning/formalized and prototyped. Each with a few examples.
Data Canvas 2
The second video breaks down the steps to a conceptual data canvas. There are a lot of questions that you should ask yourself, while documenting the answers on a canvas. After mapping out, you can proceed with a more formalized or even a prototyped version of the data canvas, see below.
DataCanvas Tool
We have built a tool for designing with a prototyped data canvas in OOCSI, and this tool is directly available from every OOCSI server: https://server-address/datacanvas
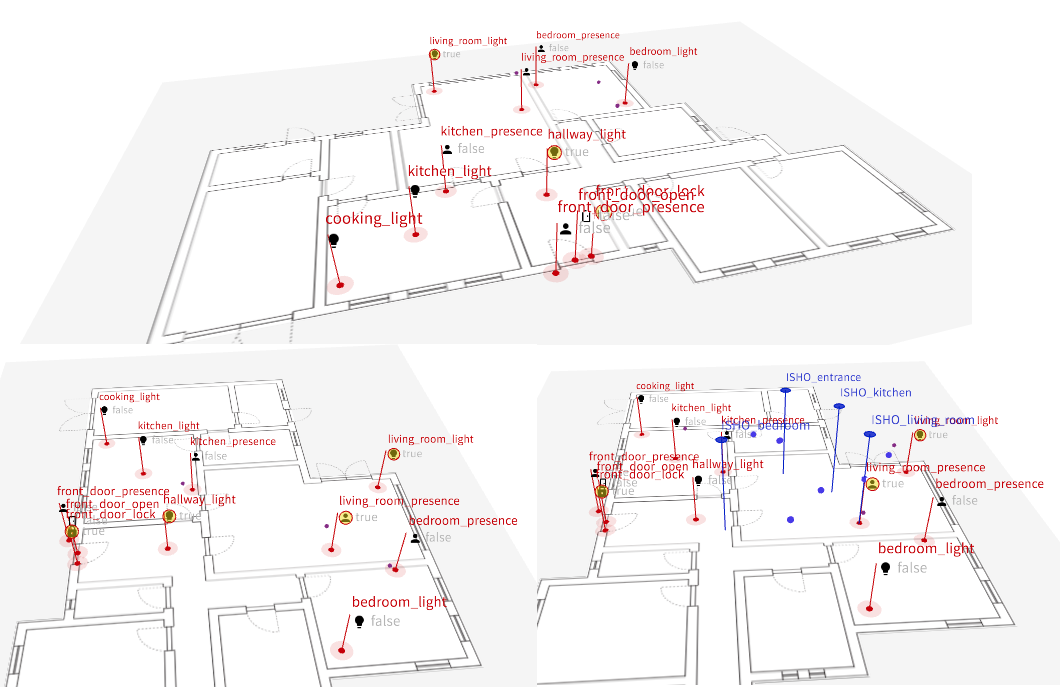
To start, you enter a token that you should also share with any collaborators that you might have in your design project. After entering the token, you see the empty canvas with a few controls at the top. Now, click pon “Discover Clients” to add a first client name to the canvas. If the client is sending data, the data will be tracked the recipient of the messages will be also added to the canvas, including channels that you might use in the communication. So, after a while the canvas populates itself with discovered clients and channels. Don’t forget to play with the controls to explore the data canvas while it’s evolving. The figure below shows three screenshots of the tool in action.

You might have noticed that the figure above shows a lot more information per client than what you have supplied so far, icons and additional labels. This is information that is coming from the heyOOCSI! extension of OOCSI. Once a client implements this extension, the data shared with heyOOCSI! will become available also on the data canvas.
There are more videos around on OOCSI, check them out!